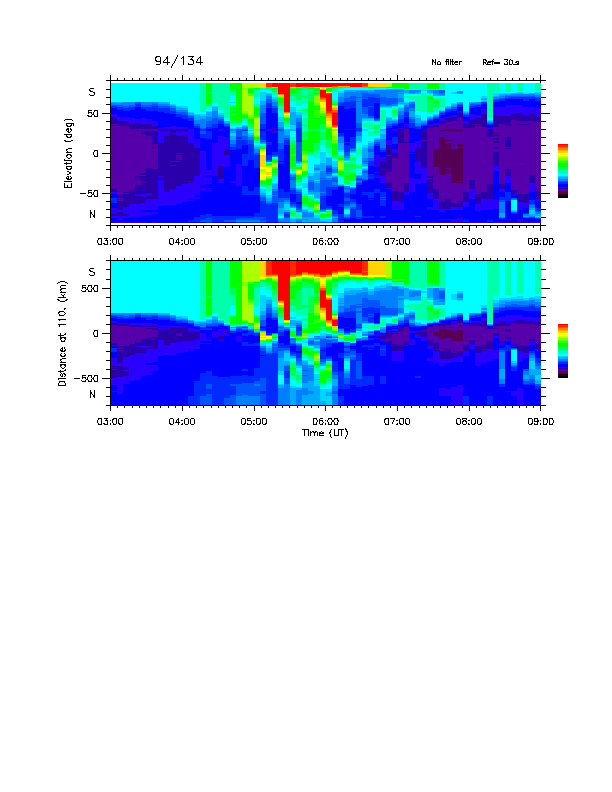
| Example of a keogram showing a night's data from the Halley all-sky camera. Data is shown for 18 hours starting on day 134, 199; the upper panel displays the intensity of auroral emission (colour) as a function of time and elevation angle from the zenith, the lower panel is similar but is plotted against the horizontal distance north/south of Halley at 110km. Several structured arcs are seen to pass across the field-of-view during the period 05:00 to 06:15 UT. | ||
 |