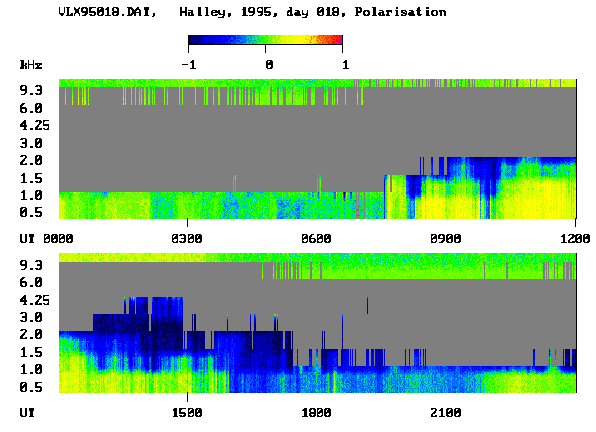
| Polarisation spectrum plot for the same day as the previous figure. The colour represents the ellipticity of polarisation (Smith, 1995). The data are thresholded so that ellipticity data are only plotted when the power exceeds a level of 35 dB. Distant signals, such as the lightning spherics, have mainly linear polarisation. For closer ranges the polarisation tends to be more circular. | |
|
|