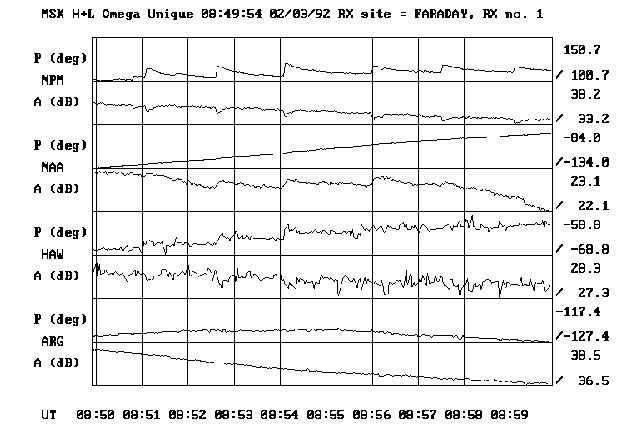
| Trimpi plot (narrow band). The amplitude and phase are shown for four VLF transmitters: NPM (Hawaii) 23.4 kHz, NAA (Maine) 24.0 kHz, Omega Hawaii and Omega Argentina. For the Omega stations, the unique frequency is shown (11.8 kHz and 12.9 kHz respectively). Amplitude is plotted in dB and phase in degrees, as indicated by the scales at the right of the plot. The asymmetrical Trimpi events (rapid onset, slow decay) are clearly seen throughout the ten-minute interval (0850-0900UT 2 March 1992). See Lev Tov et al., 1996 for further explanation. | |
|
|