 reme
and astonishingly rapid water-level fluctuations at the Norwegian
offshore site
reme
and astonishingly rapid water-level fluctuations at the Norwegian
offshore site
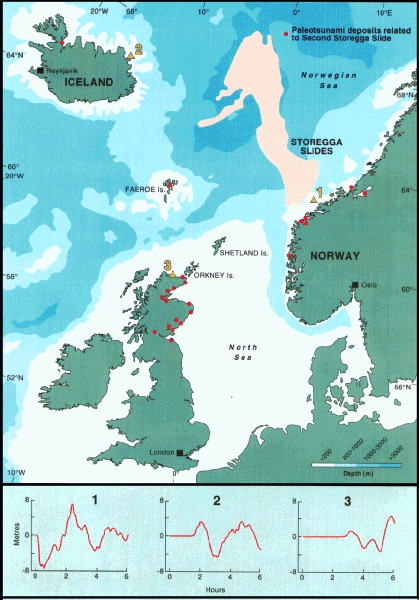
Figure 1
Bathymetric map of Norwegian Sea and North Sea regions showing
area of the Storegga submarine landslides (after Bugge, 1983 and
Bugge et al., 1987). Dots show the principal locations where coastal
deposits exist that have been attributed to deposition by the
tsunami generated by the Second Storegga Slide. The graphs for
sites 1, 2 and 3 are numerical model predictions of tsunami height
offshore according to Harbitz (1992) (cf. also Figure 16). Note
the pronounced initial drawdown and the extreme
and astonishingly rapid water-level fluctuations at the Norwegian
offshore site