
| 1996 | 1997 | 1998 | 1999 | 2000 | 2002 | Related material | Ronne calving | Ross (23/03/2000) | Mass balance of Antarctica | http://www.natice.noaa.gov | NSIDC ice shelves | solcomhouse's piccies |
Antarctic climate change - a position statement by the British Antarctic Survey.
Pictures of the ice breakout taken by plane
RETREATING ICE SHELVES: Questions and answers from the British Antarctic Survey
This is not the page about the Ronne calving event, which is different! Nor is about the most recent giant Ross berg: see http://www.nsf.gov/od/lpa/news/press/00/pr0012.htm for that [23/03/2000].
If you want to read what the BBC has to say in their news report from late January 1998 (not a good idea; its somewhat misleading), see here.
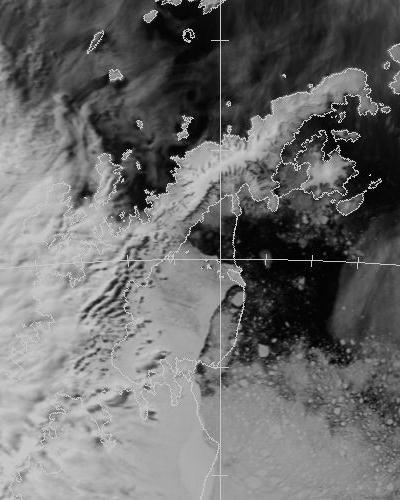
 The "before" picture is taken at 11 GMT, 9/Jan/95.
It is before the iceberg calved, but after the iceshelf between James Ross Island
and the peninsula disintegrated. James Ross Island is the spidery-shaped
island slightly above left of the center of the "before" image.
The "before" picture is taken at 11 GMT, 9/Jan/95.
It is before the iceberg calved, but after the iceshelf between James Ross Island
and the peninsula disintegrated. James Ross Island is the spidery-shaped
island slightly above left of the center of the "before" image.
 The "after" is from
12 GMT, 12/Feb/1995. In this picture the iceberg has calved but has not moved far from
where it was calved.
The "after" is from
12 GMT, 12/Feb/1995. In this picture the iceberg has calved but has not moved far from
where it was calved.
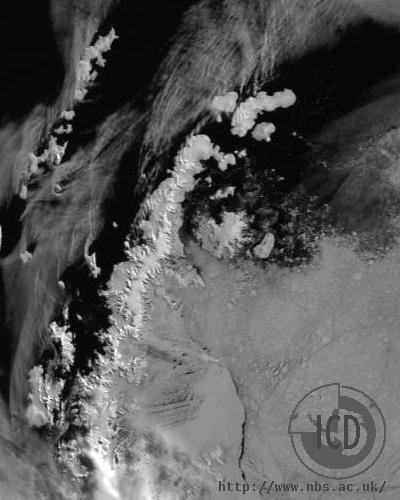
 The 27-2-95 image is 15 days later. A
segment of the ice shelf has broken up and is visible as a plume about
4 times as long as the iceberg.
The 27-2-95 image is 15 days later. A
segment of the ice shelf has broken up and is visible as a plume about
4 times as long as the iceberg.
All images are from near-visible channels and were provided by the ARIES hrpt receiver at Rothera research station. A map of the northern peninsula region is available.
A note on image quality: these images have been resampled to a somewhat lower resolution, and the colour tables have been adjusted, compared to the originals. This should be fine for general use. If you are interested in the originals for research pruposes, please contact Tom Lachlan-Cope.
I have a further picture from 30th April 1995 but its not that informative.
The ATSR people at RAL have an image from 30/04/1995 and a readme on the image. The image is really rather nice. I took a local copy of the image.
|
1996 |
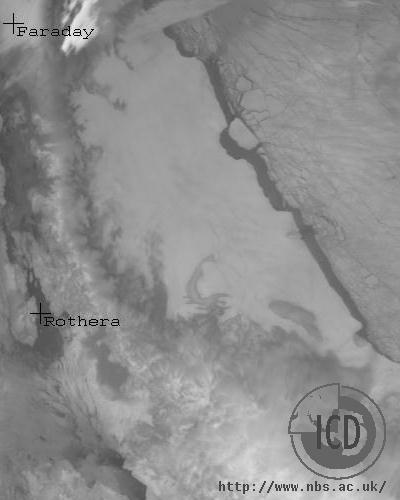
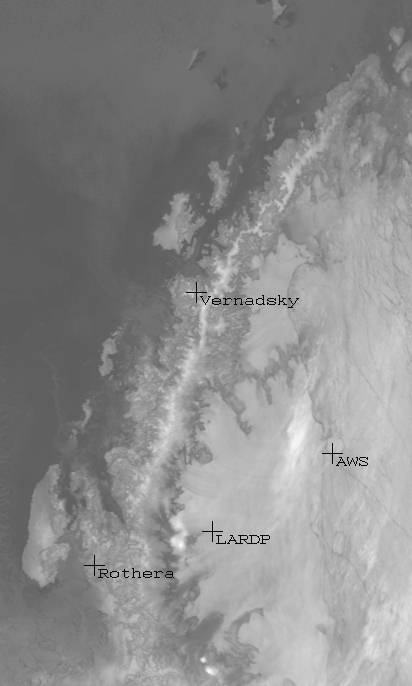
In July 1996 a further (smaller) berg, approximately 50 km long (the size of Rutland, we are calling this one), calved from further south, on the "main" Larsen ice shelf. In this picture the spine of the Antarctic Peninsula curves from bottom right to top left. The main Larsen ice shelf occupies the center of the picture and is delineated towards the top right by the dark band of the shore lead. The positions of two research stations are marked. The berg itself is visible in the upper center as a broken off chunk and corresponding "hole" in the ice shelf.
The picture is infra-red channel 4 from a NOAA satellite retreived at Rothera station at 8:24 GMT on 8/7/96. The northern (top) limit of this picture roughly corresponds to the southern limit of the previous pictures.
Thanks to: Tom Lachlan-Cope/Wookie/Frank Hindle for the image.
|
1997 |
In 1997 not a lot has happened, except that Greenpeace has generated a lot of interest in the topic (and our hit count has shot up!). This clipped image from 25th January 1997 (36k) (a fuller version is available via the aries latest images page) shows the scene and has 65 oS and 60 oW lat-long lines added for ease of navigation. It also has the old coastline on, which is kind of fun.
|
1998 |
Doake et al. published a paper in Nature (19/2/1998) suggesting that a smallish further retreat of the Larsen B would signal its rapid collapse.
Ted Scambos has now suggested that this slight further retreat is ocurring: "Breakup of Larsen B Ice Shelf May Be Underway".
We have some more pictures from December 1997.
|
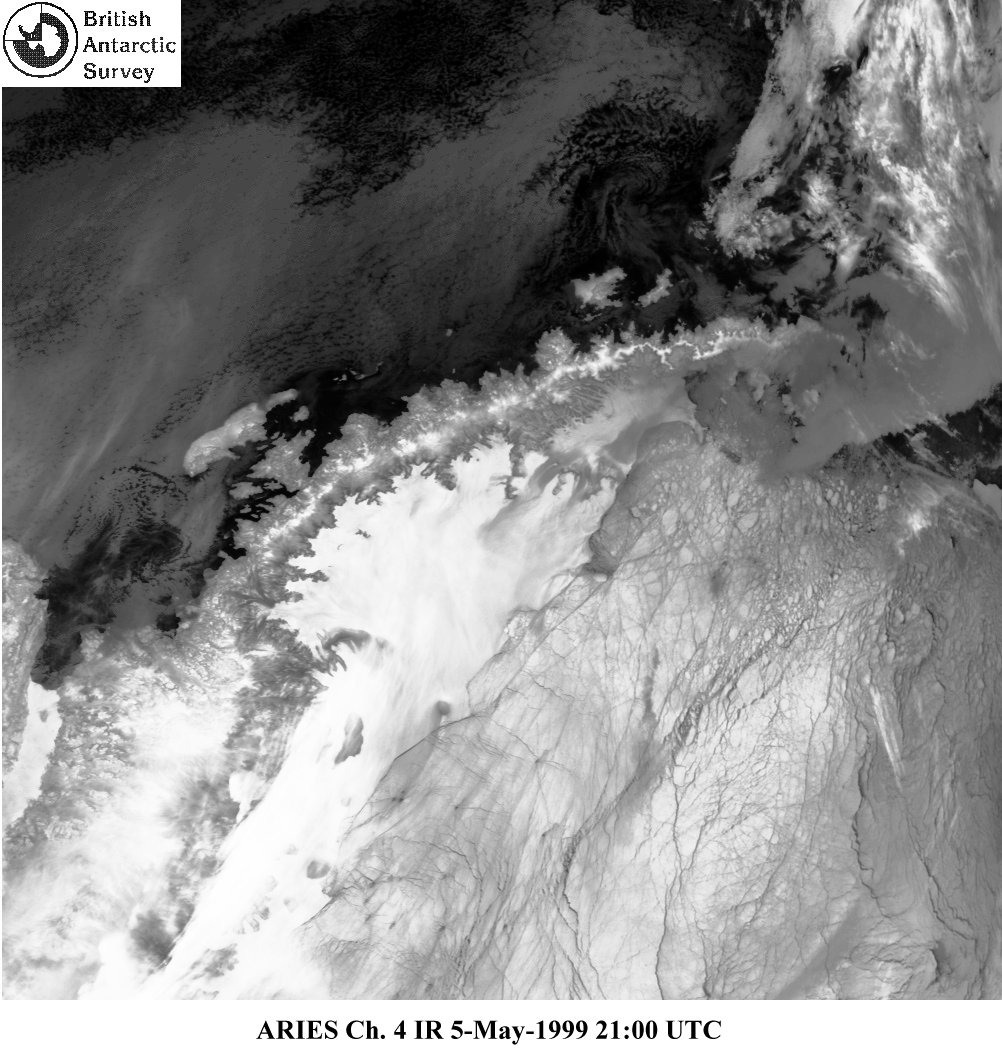
1999 |
Two piccies of the area:
| 01/02/1999 | 05/05/1999 |  |
 |
400x400 & 800x800 | 200k; 1000x1000 |
More Larsen breakup seems to be underway...
A rather blurred report appeared on Lycos.
August 1999 [click for larger image]; thanks to Russ Ladkin for the image:
|
2000 |
Happy new millennium to the Larsen...
Two piccies:
Here is another one.
|
2002 |
BAS press release on the Larsen B collapse.
|
|
If you care to, you can read the "official" BAS/ICD statement
Antarctic climate change - a position statement by the British Antarctic Survey.
Ted Scambos and Christina Hulbe have put together a nice page entitled
Recent Events in the Northern Larsen Ice Shelf
and Their Importance.
CH has written an article in a web magazine:
RECENT CHANGES TO ANTARCTIC
PENINSULA ICE SHELVES: WHAT LESSONS HAVE WE LEARNED?.
A somewhat alternative viewpoint is provided by
Greenpeace.
[I should point out that inclusion of a link on this page does not imply
endorsement of the views contained therein...]
Perhaps you'd like to see what the "Meeja" are making of all this...
try a transcript with piccies of
The News Hour with Jim Lehrer
from March 6 1997. It has some nice typos
(penguins being attacked by "marauding skewers") and some science too.
Thanks to Christina Hulbe
for pointing this reference out on the IGS.
Antarctic meteorology is available from
Metlog at BAS;
composite Antarctic satellite pics are available from
http://www.ssec.wisc.edu/data/.
Two images similar to the first two above have appeared in Nature (??when??).
A related issue, the disintegration of the Wordie iceshelf, was covered by:
Doake, C.S.M. and D.G. Vaughan. 1991. Rapid disintegration of
Wordie Ice Shelf in response to atmospheric warming. Nature
350(6316), 328-330.
A slightly wider context comes from
Recent atmospheric warming and retreat of ice shelves on the Antarctic
Peninsula by D. Vaughan and C. Doake, Nature, 1996, v379 p328. This
shows changes (mostly decreases) in a number of ice shelves on the
Peninsula.
A detailed examination of the Larsen breakup, including SAR imagery, appears
as Rapid Collapse of the Northern Larsen Ice Shelf, Antarctica,
by Rott,H; Skvarra, P and Nagler,T in Science,
1996, v271, p788. An accompanying comment article, An Ice Shelf Breakup
by Mark Fahnestock is on p775 of the same issue.
The American Chemical
Society
has an article entitled "Climate Observations Substantiate Global
Warming Models"
with a side-shoot
titled "Higher temperatures in Antarctica have led to
disintegration of some ice shelves".
Data covers the period 1961 to 1990
and is taken from P.D.Jones, GRL, 1995 v22 #11 p1345.
The Picture shows circles whose size corresponds to the size of the
trend (in oC/decade) and whose colour shows the direction of the
trend: red (increasing) and blue (decreasing).
Further information on the topic of sea level rise can be found in chapter
9 of Climate Change: the IPCC scientific assessment, 1990, J.T.Houghton
et al, Cambridge University Press, UK
A note on naming of icebergs is available.
Related material/Links
 Recent observed temperature trends over Antarctica are graphed in
the accompanying picture.
Large warming trends are seen over the peninsula where the calving
shown above has occurred.
Recent observed temperature trends over Antarctica are graphed in
the accompanying picture.
Large warming trends are seen over the peninsula where the calving
shown above has occurred.
The
official version
of the
British Antarctic Survey Press Release 1/95 27 February
is also available.
 Before
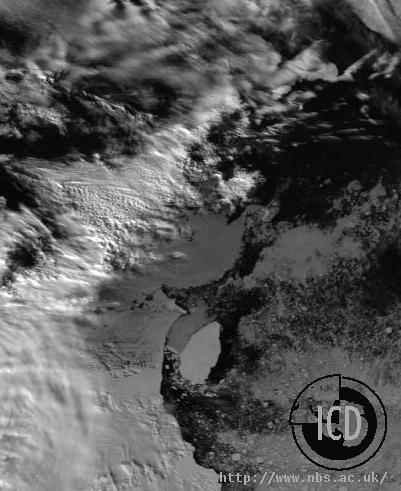 After
After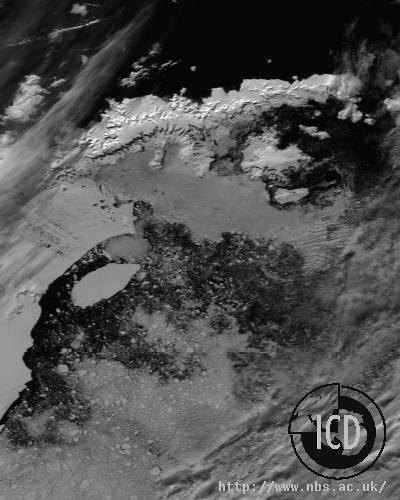 On 27/2/95
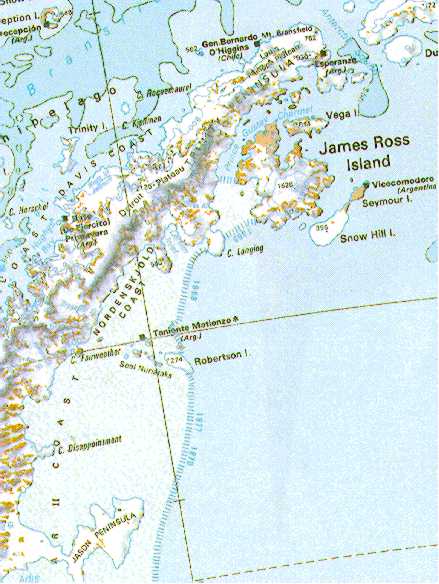